Example Usage
This tutorial illustrates the basic ideas behind the SScanSS 2 software. The files used in this tutorial can be found in the examples/simple folder in the install directory. This tutorial uses the ENGIN-X instrument and the steps shown should apply to other instruments.
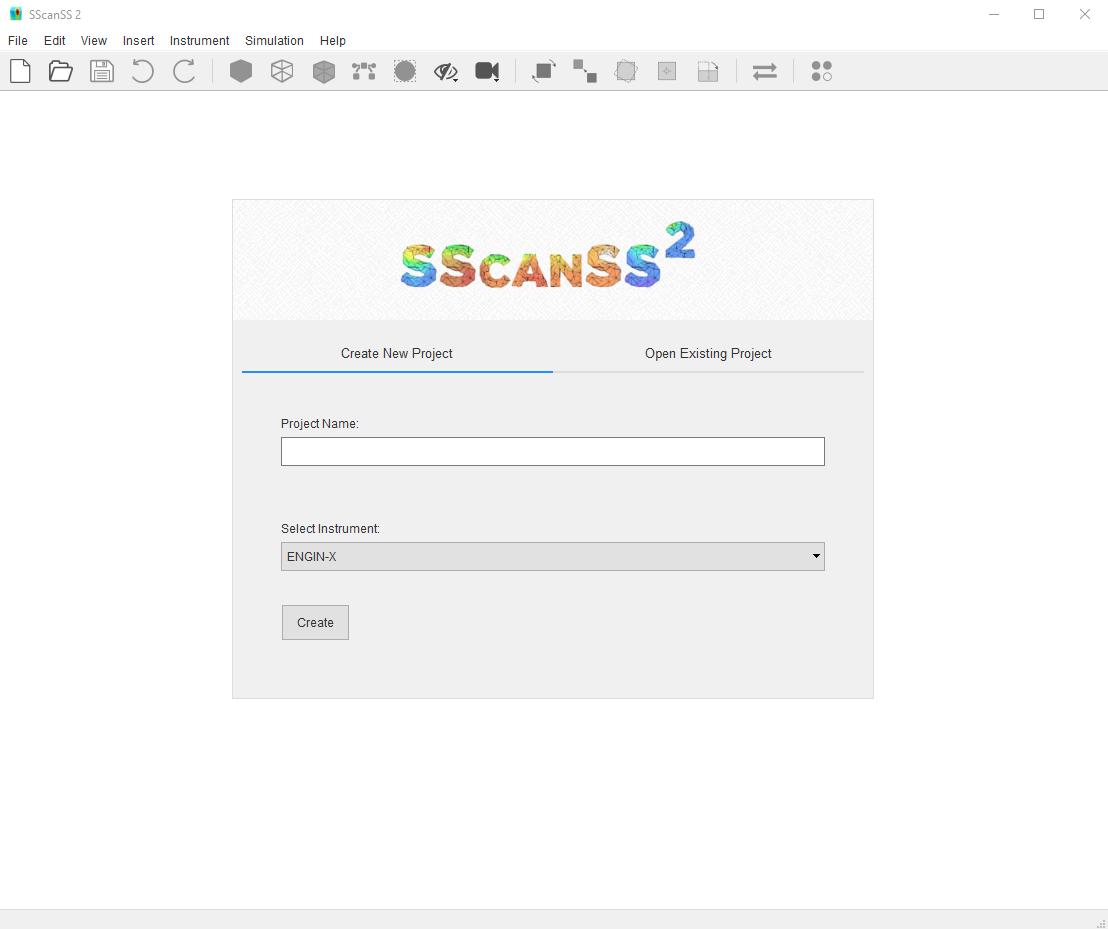
We begin by creating a new project, click File, and then click New Project. You will see the new project dialog. Type in a project name, select ENGIN-X as the instrument and the click create.
Setting up the Sample
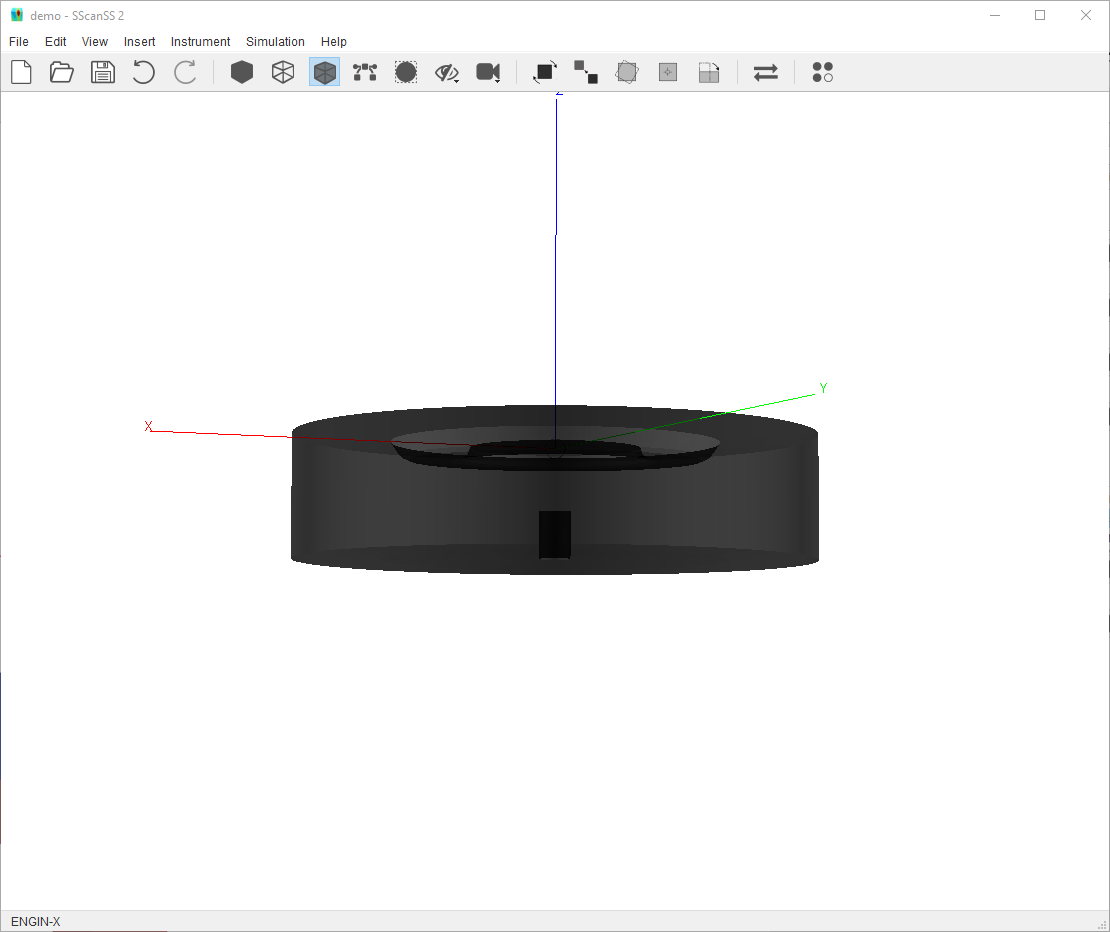
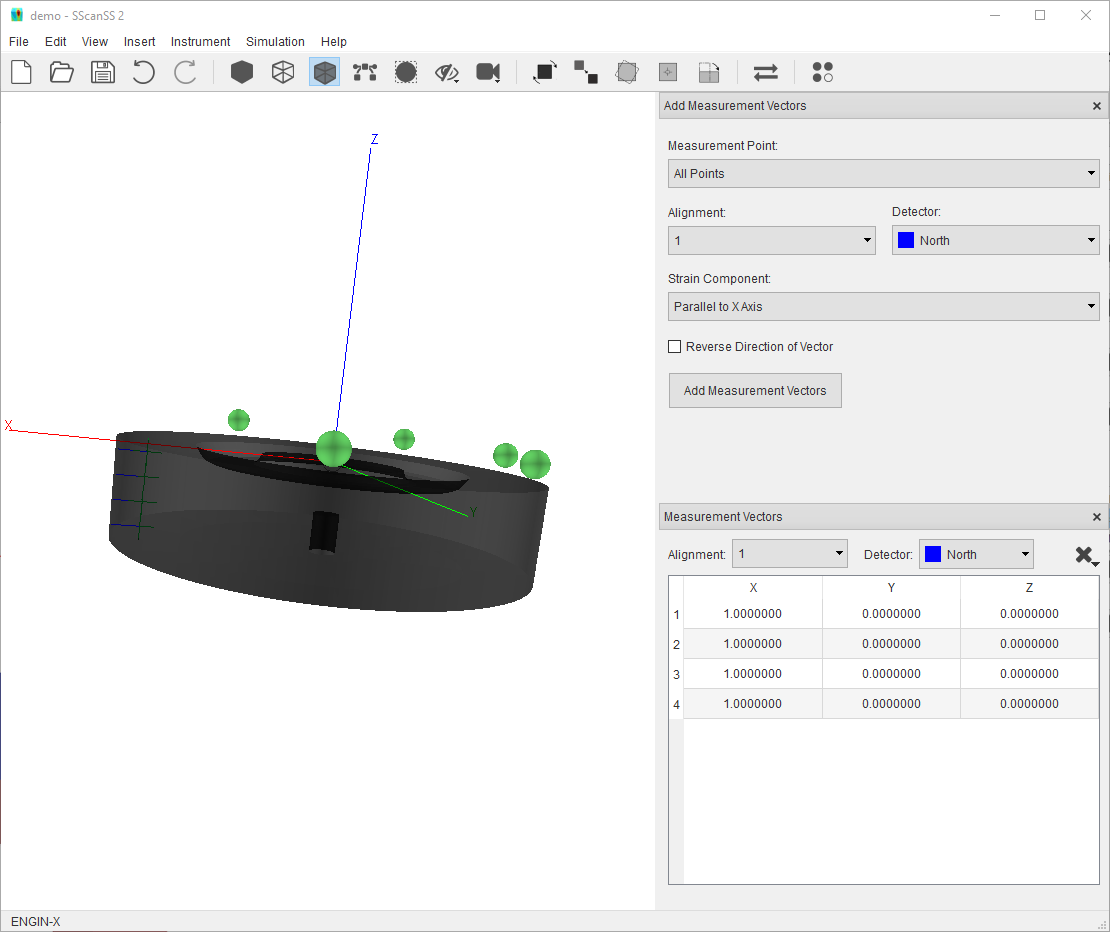
1. Click Insert > Sample > File and browse to the location of the data folder and select simple.stl. You will see the sample model in the graphics window.
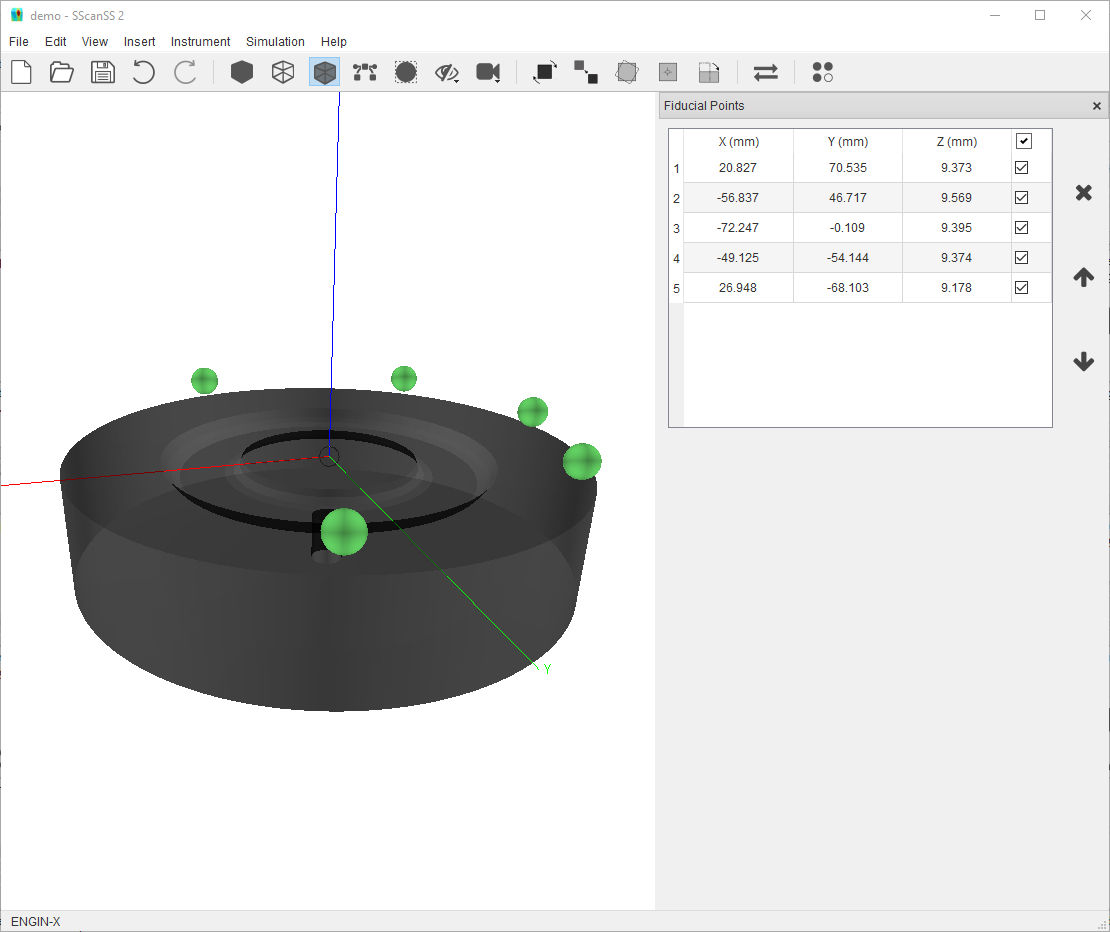
2. Click Insert > Fiducial Points > File and browse to the location of the data folder and select simple.fiducial. You will see the green spheres added in the graphics window.
3. Click Insert > Measurement Points > File and browse to the location of the data folder and select simple.measurement. You will see the green crosses added in the graphics window.
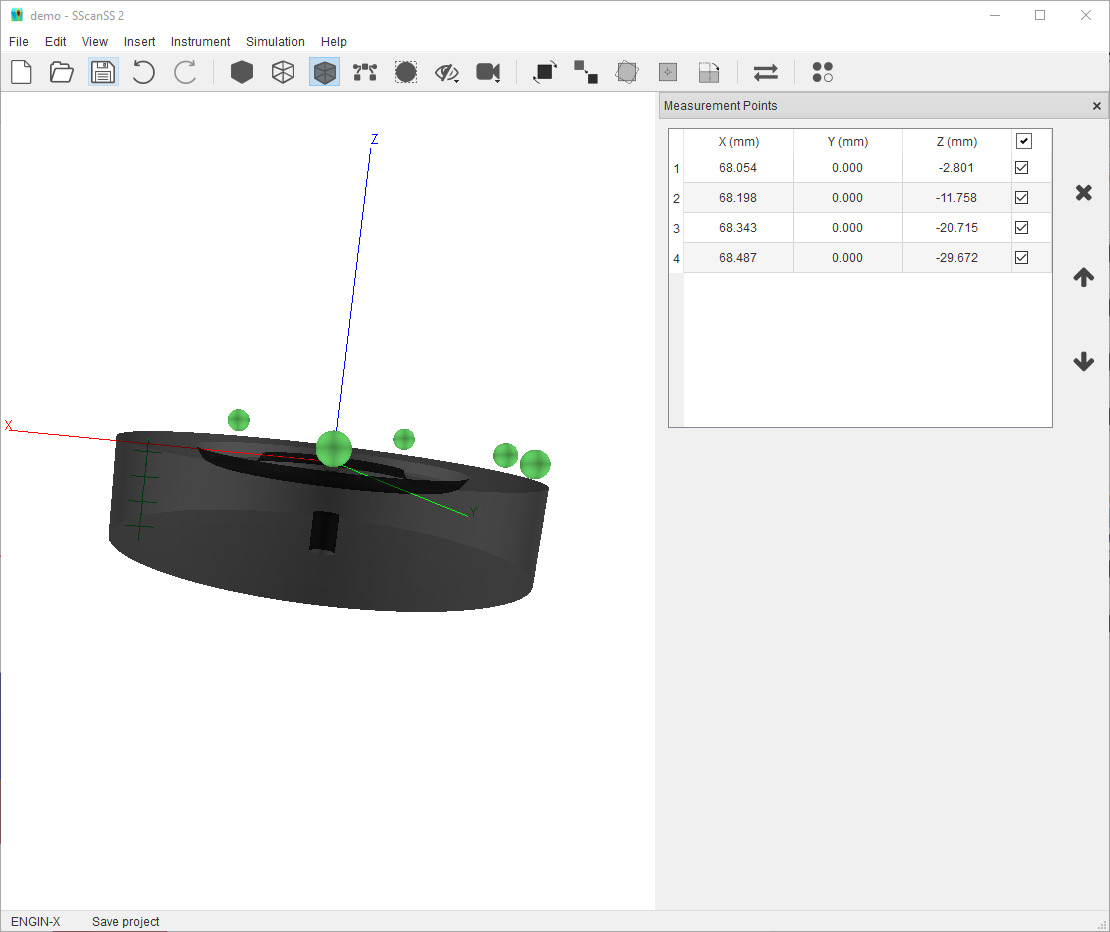
3. Click Insert > Measurement Vectors > Select Strain Component the select stain component “Parallel to X Axis”. Click Add Measurement Vectors and in the graphics window, you will see the blue line segments drawn from the measurement point along the X Axis.
Simulating a Scan
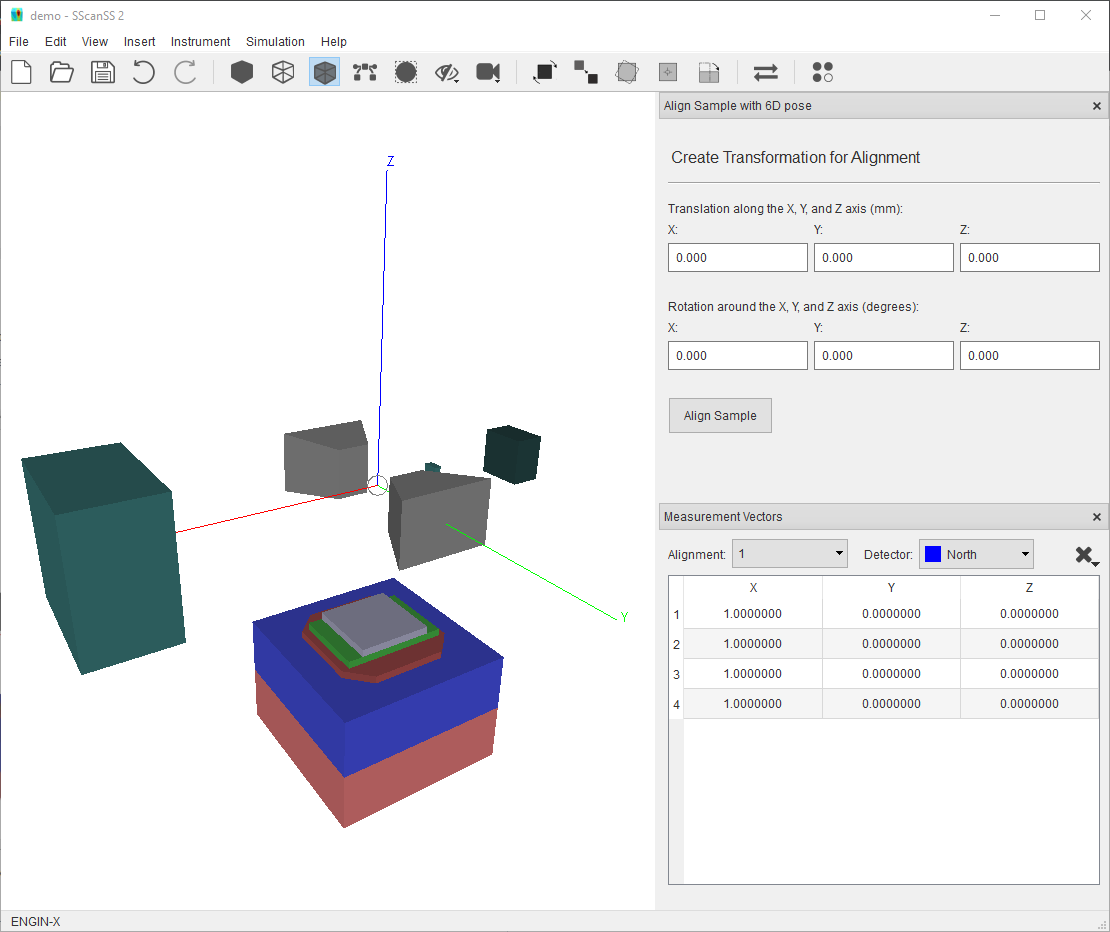
1. Before we can simulate, the sample must be aligned on the instrument. To do this, go to Instrument > Align Sample on Instrument > 6D Pose, you will see a new dialog and the model of the instrument in the graphics window.
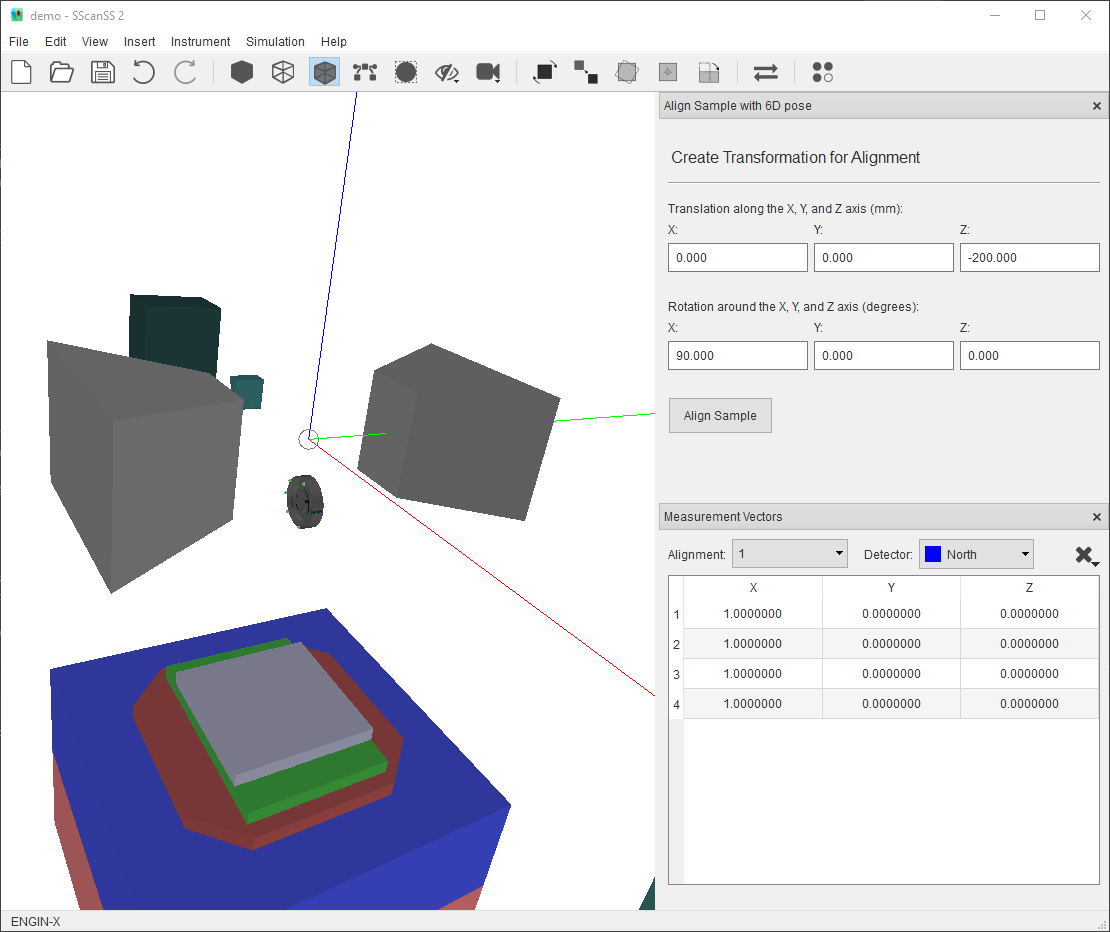
2. Specify a Z Axis translation of -200 and X Axis Rotation of 90. Click Align Sample, you see the sample model, fiducials, measurement points and vector
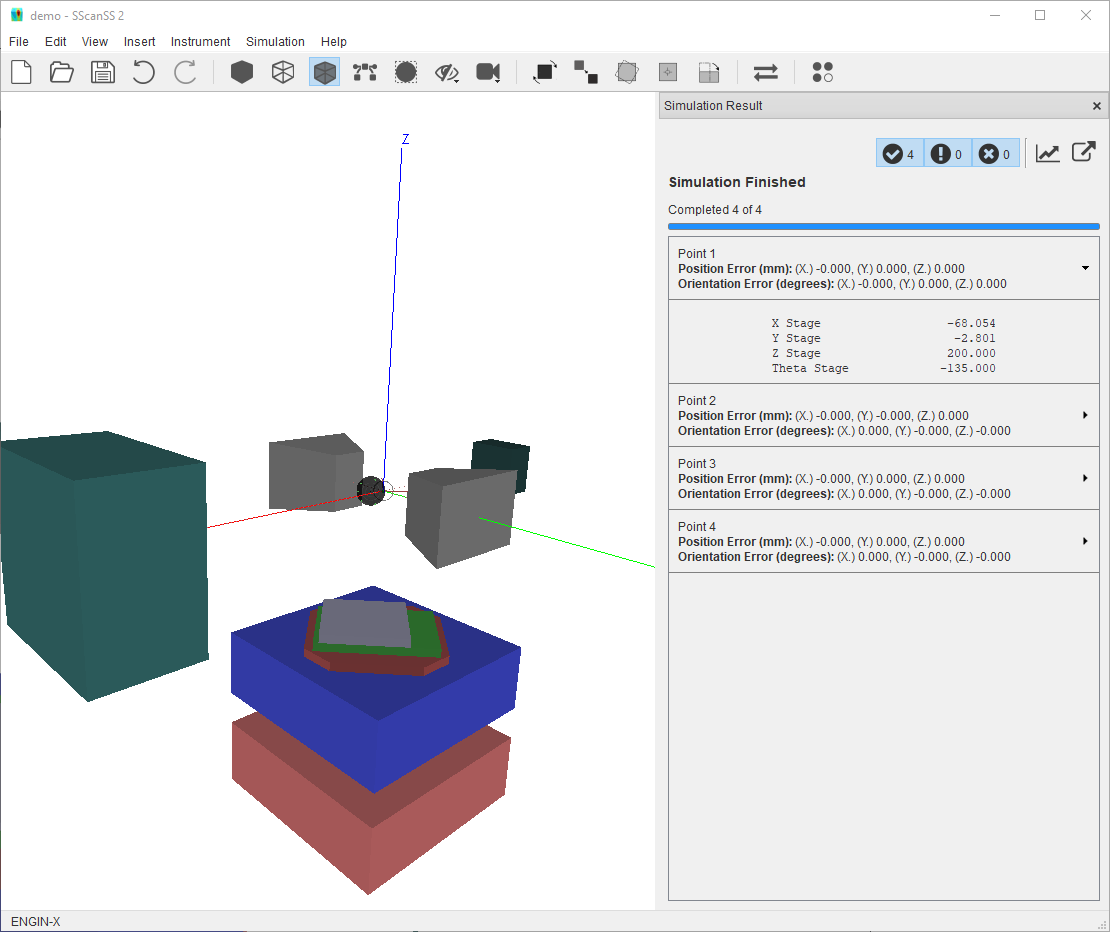
3. Start a new simulation by clicking Simulation > Run Simulation or the F5 key. You will see the instrument move the sample into the appropriate position and orientation for each measurement and the results displayed in simulation window
4. The script to perform the measurement on the real world instrument (if the sample was mount exactly the same) can be exported by clicking File > Export > Script and then click Export on the script dialog.